Posts

Confidence Interval function with LAMBDA and Optional Parameters
Image
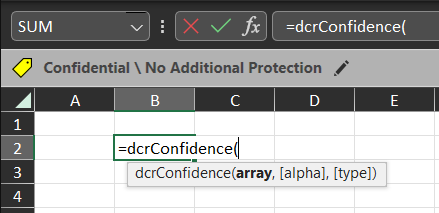
Excel provides CONFIDENCE.T  formula to calculate the confidence interval. This value, however, does not stand on its own. We usually want to know the upper and lower confidence limits as well.  In this blog, I will implement the calculation of upper and lower confidence intervals using LAMBDA. I will also demonstrate how to implement optional parameters, if a different significance level from the default 5% is required. But before that, I will introduce the LET function. LET Function The LET  function assigns names to calculation results. This is useful for storing intermediate results or values, or defining names inside a formula. The general syntax is as follows: =LET(name1, name_value1, [name2, name_value2,...], calculation) It supports up to 126 name-and-value pairs . The last parameter calculation is the return result of LET . Let's see this in action. Confidence Interval function I will create a new function  dcrConfidence  that takes an  array  and calculates the confide

Creating Table Arrays with LAMBDA

Image
Recap from the last blog, our intention is to build various custom statistical functions in Excel using the LAMBDA feature. This week I will create a Table Array using LAMBDA. Excel has VSTACK and HSTACK formulas to create Arrays. Combining these two functions we can build Tables Arrays. We will use Table Arrays to display statistical information. For a start I will create a simple About summary. Create a new formula with the following details: Name : dcrAbout Comments :  Returns a summary about dcRacoon Statistics. Refers To :  =LAMBDA(     HSTACK(       VSTACK(         "Author",         "Version",         "Last Update",         "Web"       ) ,       VSTACK(         "DC Racoon",         "0.1",         "21-Dec-2022",         "https://dc-den.blogspot.com"       )     ) ) The HSTACK creates a horizontal array (columns). And the VSTACK creates vertical arrays, the first being the items in each row, and the s

Better Charts

Image
Summary: December sale expected to stay above 60,000 units for the 5th consecutive month. A flattish  quarter-on-quarter in the 4th quarter is expected. Analysts forecast a lower sale in 2023. A recent news report showed a chart on vehicle sales. I reproduced the chart above and thought of improving it. As I am not an analyst in the transportation, I will refrain from making comments and stick only to improving the chart. At first glance, the chart is cluttered and it was hard to see where the story was getting at. I was also unconvinced with the 3 summary points to the right of the chart, as the graphs do not bring the points out. The first thing I did was declutter the chart by switching to line graphs instead. I kept the original author's intention to show a month-on-month view. I did not show the data points as it makes the chart untidy. I also reduced the vertical axis granularity. The covered range becomes clearer. To bring out the poin

Creating Standard Error function with Excel LAMBDA

Image
LAMBDA  is available in Excel for Microsoft 365 and Excel for the Web. LAMBDA allows users to implement custom Excel formulae without resorting to VBA macros. LAMBDA essentially keeps Excel within Excel. This blog build various reusable statistical features and inference functions using LAMBDA. For a start, we will implement the Standard Error for a sample mean. Firstly the Standard Error for a sample mean is defined as: The syntax for LAMBDA is =LAMBDA([parameter1, parameter2, …,] calculation)  So the LAMBDA function implementation would be =LAMBDA(array, STDEV.S(array)/SQRT(COUNT(array)) ) The array is the input parameter or variable, while the STDEV.S(array)/SQRT(COUNT(array))  part is the standard error calculation. To create this LAMBDA as a reusable function: Open Excel > Formulas > Name Manager In the Name Manager dialog, click New Enter: Name: dcrStErr Comments: Returns the standard error of a sample mean. Refers to: =LAMBDA(array, STDEV.S(array)/SQRT(COUNT(array))) Cli

DC Racoon's Statistical Journey with Excel

Image
Microsoft Excel is a fantastic and useful tool for a range of purposes. You can use it as a spreadsheet, for project tracking,  data graphing,  or as a visualisation tool. You can pull data from files, websites, or databases. Data can be sliced, spliced and analysed. You can build static and  dynamic  dashboards with graphs, and publish them to the Internet. You can automate repeated tasks and write scripts for custom tasks. Recently I had the time and the opportunity to learn Excel's statistical sample testing functions. I will blog and share with you on using Excel for simple statistical analysis. With Microsoft 365, Excel introduced the LAMBDA function with which you can create custom formula. But you may ask, why Excel? Isn't other statistical software out there much better? Case for Excel Readily Available Due to Microsoft Office dominance in the corporate world, Excel is available in most organisations. I have not been in any company that did not have Excel in their deskt

Visualising Structured Cabling

Image
When we first started out, we were given an Excel document tabling the Structured Cabling design.  It was hard to follow as it had many rows and columns. We assumed it was accurate but we had a hard time imagining the layout. We had to draw on paper to grasp how the cables were to be connected. Fortunately we had a vendor. They converted the table into a fancy Visio document.  Fancy because it puts management at ease when they see a diagram. For management, a diagram implies you have a clear idea on how it should be implemented. For the engineers, while visually accurate, the document but still difficult to read. Improvement to the table Recently, I was reviewing another data centre's structured cabling design. They grouped the ports by slots; example Ports 1-12 = Slot 1, Ports 13-24 = Slot 2, etc. So when it came to my design, I used the same idea. Removing clutter in your table makes it easier to read. This wasn't a major improvement, but the slots gave me the next idea. Visu

Data centre expanding! Follow DC Raccoon's journey!

Image
Our Data Centre is expanding. Follow DC Raccoon as he journeys into the DC-Den.