Posts

Showing posts with the label Excel

Excel Range vs Array

Image
As I worked more with LAMBDA, I discovered that Excel functions that take range parameters do not work with arrays . If a function's parameter mentions "range", you can be sure this will not work with arrays. Some examples of these functions are COUNTIF , COUNTIFS , AVERAGEIF , AVERAGEIFS , SUMIF , and SUMIFS . The other that I am aware of is RANK.AVG . What is an Array? A Range represents a cell, a row, a column, a selection of selections, or blocks of cells. Range will always have an address, for example B2:B5 is a range of values stored in a column. An Array is a set of values constructed using a formula. For example  ={1;2;3;4} is column of values. =VSTACK(1,2,3,4) is also a column of values. The FORMULATEXT function would return #N/A in a range cell that contains only values. On the other hand it returns the formula used to construct the array values. An array can be displayed on a spreadsheet. When displayed on the spreadsheet, the values can be referred by the

Formula Name Manager Limit: ~2084 Characters

Image
While trying to implement a LAMBDA function I found myself unable to paste my formula into the Formula Name Manager. My first thought was that the LAMBDA has a character limit. But further investigation showed it was related to the Formula Name Manager, specifically the Refers to: field. Also it is not  related to the Name or the Comment field. Tweaking my formula the maximum number of characters is about 2084. Whitespaces are counted. This includes carriage returns and tabs. So, when implementing LAMBDA with the Formula Name Manager, do remember to keep your formula as concise as possible, but don't be too sloppy with variable names and indentation. That said, go edit your LAMBDA in your DC-DEN! Update: The Comment:  field limit is 256 characters.
Image
  Recently I saw some Travel facts and figures for the Lunar New Year 2023 . The table for the Top Five Destinations (see above) was interesting but difficult to digest. Would it be possible to summarise this? Would it be possible to make this table more comprehensible at a glance? It may mean turning this table into some form of a diagram. A network diagram or Sankey diagram would probably do the job. But what if Excel was the only that I had? This would be challenging. Converting Table Information into Data Table above presents nominal data. There are a number of options to convert it into numerical data. Using Excel, it was easy to auto-calculate a count of the mentioned countries. Frequency is the number of times the country is mentioned in the Table. A simple COUNTIF  formula gave the results instantly. The Ranked is a weighted preference of destination. I put an arbitrary weightage of 5, 4, .., 1 for Top 1, Top 2, ..., Top 5 in reverse order respectively. As an example, if Thai

Confidence Interval function with LAMBDA and Optional Parameters

Image
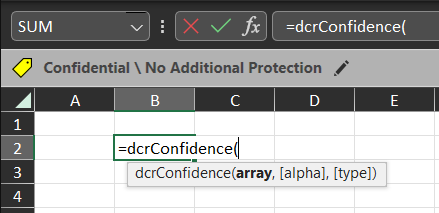
Excel provides CONFIDENCE.T  formula to calculate the confidence interval. This value, however, does not stand on its own. We usually want to know the upper and lower confidence limits as well.  In this blog, I will implement the calculation of upper and lower confidence intervals using LAMBDA. I will also demonstrate how to implement optional parameters, if a different significance level from the default 5% is required. But before that, I will introduce the LET function. LET Function The LET  function assigns names to calculation results. This is useful for storing intermediate results or values, or defining names inside a formula. The general syntax is as follows: =LET(name1, name_value1, [name2, name_value2,...], calculation) It supports up to 126 name-and-value pairs . The last parameter calculation is the return result of LET . Let's see this in action. Confidence Interval function I will create a new function  dcrConfidence  that takes an  array  and calculates the confide

Creating Table Arrays with LAMBDA

Image
Recap from the last blog, our intention is to build various custom statistical functions in Excel using the LAMBDA feature. This week I will create a Table Array using LAMBDA. Excel has VSTACK and HSTACK formulas to create Arrays. Combining these two functions we can build Tables Arrays. We will use Table Arrays to display statistical information. For a start I will create a simple About summary. Create a new formula with the following details: Name : dcrAbout Comments :  Returns a summary about dcRacoon Statistics. Refers To :  =LAMBDA(     HSTACK(       VSTACK(         "Author",         "Version",         "Last Update",         "Web"       ) ,       VSTACK(         "DC Racoon",         "0.1",         "21-Dec-2022",         "https://dc-den.blogspot.com"       )     ) ) The HSTACK creates a horizontal array (columns). And the VSTACK creates vertical arrays, the first being the items in each row, and the s

Creating Standard Error function with Excel LAMBDA

Image
LAMBDA  is available in Excel for Microsoft 365 and Excel for the Web. LAMBDA allows users to implement custom Excel formulae without resorting to VBA macros. LAMBDA essentially keeps Excel within Excel. This blog build various reusable statistical features and inference functions using LAMBDA. For a start, we will implement the Standard Error for a sample mean. Firstly the Standard Error for a sample mean is defined as: The syntax for LAMBDA is =LAMBDA([parameter1, parameter2, …,] calculation)  So the LAMBDA function implementation would be =LAMBDA(array, STDEV.S(array)/SQRT(COUNT(array)) ) The array is the input parameter or variable, while the STDEV.S(array)/SQRT(COUNT(array))  part is the standard error calculation. To create this LAMBDA as a reusable function: Open Excel > Formulas > Name Manager In the Name Manager dialog, click New Enter: Name: dcrStErr Comments: Returns the standard error of a sample mean. Refers to: =LAMBDA(array, STDEV.S(array)/SQRT(COUNT(array))) Cli

DC Racoon's Statistical Journey with Excel

Image
Microsoft Excel is a fantastic and useful tool for a range of purposes. You can use it as a spreadsheet, for project tracking,  data graphing,  or as a visualisation tool. You can pull data from files, websites, or databases. Data can be sliced, spliced and analysed. You can build static and  dynamic  dashboards with graphs, and publish them to the Internet. You can automate repeated tasks and write scripts for custom tasks. Recently I had the time and the opportunity to learn Excel's statistical sample testing functions. I will blog and share with you on using Excel for simple statistical analysis. With Microsoft 365, Excel introduced the LAMBDA function with which you can create custom formula. But you may ask, why Excel? Isn't other statistical software out there much better? Case for Excel Readily Available Due to Microsoft Office dominance in the corporate world, Excel is available in most organisations. I have not been in any company that did not have Excel in their deskt