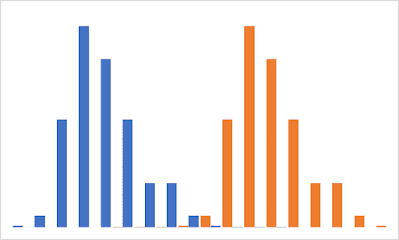
When it is not Normal... The Mann-Whitney Test

The Mann-Whitney Test Mann-Whitney test helps you compare two sets of data when they are not normally distributed. I would use Mann-Whitney test only after I confirm using the Anderson-Darling test . I should add that I run a box-plot first before running the AD test. I used to think that Mann-Whitney compares the medians of two data sets. But in the process of implementing Mann-Whitney in Excel LAMBDA, I found out that Mann-Whitney test compares the mean ranks, in doing so, it determines if the two data set came from the same population. Step 1: Group the two samples together and sort the data in ascending order, but retain their sample origin. Step 2: Rank the combined data. Step 3: Separate the data back into the two samples. Sum the ranks for each sample. Step 4: Compute the test statistics U `U_1 = R_1 - (n_1(n_1+1))/2` and `U_2 = R_2 - (n_2(n_2+1))/2` Step 5: Choose the small U to calculate the equivalent z-statistics. `z = (U - m_U) / sigma_U` where `m_U` and `sigma_U...