Posts

Showing posts with the label Statistics

Which Test To Use?

Image
You conducted your survey and collected your data. You plotted your charts and suspect a certain conclusion. Which test should you use to validate your hypothesis? Having learnt different statistical tools and showing their implementation in Excel LAMBDA, we want a reference to guide us. Qualitative and Quantitative Data The first is to distinguish the type of data. Data can be qualitative or quantitative . Qualitative data can be nominal or ordinal. Nominal data are named categorised data, for example gender:{male, female} and direction:{north, south, east, west}. Ordinal data are categories with implied order, for example size:{small, medium, large}, school grades:{A, B, C, D, E} and service rating:{very poor, poor, average, good, great}. The order however are not equally spaced, i.e. you cannot equate the difference between poor and average, with the difference between average and good. Quantitative data can be interval or ratio. Unlike qualitative data, quantitative data are equal

Hypothesis Testing

Image
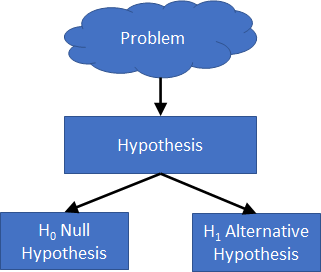
Hypothesis testing is the analysis of data using statistical methods, to assess if a statement (hypothesis) is true. Typically you form two possibilities: a Null Hypothesis proposing that there is NO statistical significance in the given set of observations, and an Alternative Hypothesis that contradicts the Null Hypothesis. The Alternative Hypothesis is what you are trying to test. If the finding is statistically significant, you reject the Null Hypothesis. Suppose you want to find out if a group of 11-year old children has the same average weight as the population's 11-year old children (problem). You would state the Null Hypothesis and the Alternative Hypothesis as: `H_0: bar x = mu` `H_1: bar x != mu` where `bar x` is the sample group mean weight of 11-year old children `mu` is the population mean weight of 11-year old children Pictorially you are trying to prove this. Two-Tailed and One-Tailed The above scenario is called a Two-Tailed test, as we are proving equality. A One-T

Z Score, Z Statistics and P value

What is a Z score or Z statistics? Firstly Z score and Z statistics is the same. It is a measure of the number of standard deviations a data point is away from the sample mean. Mathematically this is written as: `z = (x - bar x) / sigma` where `z` = Z score or Z statistics `x` = data point `bar x` = sample mean `sigma` = sample standard deviation The mathematical equation of standard deviation is: `sigma = sqrt((x - bar x)/N)` where `N` = number of sample points What is P value? The P value is the probability that a particular value assuming the null hypothesis is true. Conventionally a P value of less than 0.05 is grounds for rejecting the null hypothesis. For the lower-tailed test or left-tailed test, the P value is expressed as: `P = Pr(TS <=ts | H_0) = cdf(ts)` And for the upper-tailed test or right-tailed test, the P value is expressed as: `P=Pr(TS>=ts |H_0) = 1-cdf(ts)` And the P value for a two-tailed test is `P = 2 xx min{Pr(TS<=ts |H_0), Pr(TS>

DC Racoon's Statistical Journey with Excel

Image
Microsoft Excel is a fantastic and useful tool for a range of purposes. You can use it as a spreadsheet, for project tracking,  data graphing,  or as a visualisation tool. You can pull data from files, websites, or databases. Data can be sliced, spliced and analysed. You can build static and  dynamic  dashboards with graphs, and publish them to the Internet. You can automate repeated tasks and write scripts for custom tasks. Recently I had the time and the opportunity to learn Excel's statistical sample testing functions. I will blog and share with you on using Excel for simple statistical analysis. With Microsoft 365, Excel introduced the LAMBDA function with which you can create custom formula. But you may ask, why Excel? Isn't other statistical software out there much better? Case for Excel Readily Available Due to Microsoft Office dominance in the corporate world, Excel is available in most organisations. I have not been in any company that did not have Excel in their deskt