Hypothesis Testing
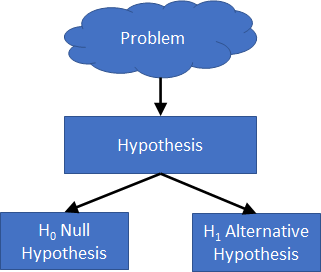
Typically you form two possibilities: a Null Hypothesis proposing that there is NO statistical significance in the given set of observations, and an Alternative Hypothesis that contradicts the Null Hypothesis. The Alternative Hypothesis is what you are trying to test. If the finding is statistically significant, you reject the Null Hypothesis.
Suppose you want to find out if a group of 11-year old children has the same average weight as the population's 11-year old children (problem).
You would state the Null Hypothesis and the Alternative Hypothesis as:
`H_0: bar x = mu`
`H_1: bar x != mu`
Pictorially you are trying to prove this.
Two-Tailed and One-Tailed
The above scenario is called a Two-Tailed test, as we are proving equality.
A One-Tailed test is proving the sample greater than or less than the expectation.
In a Left-Tailed test, you are trying to prove the sample mean is greater than that of the population.
`H_1: bar x < mu`
While a Right-Tailed test, you are trying to prove the sample mean is lesser than that of the population.
`H_1: bar x > mu`
Note: The Null Hypothesis equation always have the equal sign, while the Alternative Hypothesis equation does not.
Hypothesis Testing Steps
In a typical hypothesis testing, the steps are:
- Write the hypothesis statement
- Select the relevant Test Statistic
- Calculate the Test Statistic score
- Calculate the p-value
- Make conclusion
By creating reusable Excel LAMBDA functions, we are providing tools for steps #3 and #4, to address tests such as One- and Two- Proportion tests, Mean T test, ANOVA test, and others. You would still need to consider the problem statement, what you want to test, and what to conclude with the results.
I hope this blog post helps you in understanding statistical hypothesis testing. Until the next blog post, do think of data that you should test in your DC-DEN!


Comments
Post a Comment