Posts

Creating One Proportion Test with LAMBDA

Image
What is One Proportion Test The One Proportion Test compares a sample proportion against a target proportion. For example, you observe that you get 6 heads when you flip a coin 10 times (sample). You expect with a fair coin, the probability of getting heads is 0.5 or 50% of the time (target). The One Proportion Test allows you to assess if the flipped coin is a fair coin based on the observations. The test proves this by statistically comparing the observed proportion of heads to number of flipping 0.6, is equal to the expected proportion 0.5. We write the Null Hypothesis as the observed proportion is equal to the hypothesised proportion. `H_0: p = p_0` And the Alternative Hypothesis is that the observed proportion is not equal to the hypothesised proportion (two-tailed test). `H_1: p != p_0` We could also test if the observed proportion is greater than the hypothesised proportion (left tail test). `H_0: p >= p_0` Or if the observed proportion is less than the hypothesised proporti
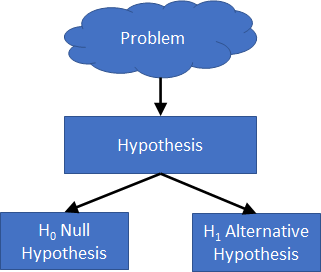
Hypothesis Testing

Image
Hypothesis testing is the analysis of data using statistical methods, to assess if a statement (hypothesis) is true. Typically you form two possibilities: a Null Hypothesis proposing that there is NO statistical significance in the given set of observations, and an Alternative Hypothesis that contradicts the Null Hypothesis. The Alternative Hypothesis is what you are trying to test. If the finding is statistically significant, you reject the Null Hypothesis. Suppose you want to find out if a group of 11-year old children has the same average weight as the population's 11-year old children (problem). You would state the Null Hypothesis and the Alternative Hypothesis as: `H_0: bar x = mu` `H_1: bar x != mu` where `bar x` is the sample group mean weight of 11-year old children `mu` is the population mean weight of 11-year old children Pictorially you are trying to prove this. Two-Tailed and One-Tailed The above scenario is called a Two-Tailed test, as we are proving equality. A One-T

Z Score, Z Statistics and P value

What is a Z score or Z statistics? Firstly Z score and Z statistics is the same. It is a measure of the number of standard deviations a data point is away from the sample mean. Mathematically this is written as: `z = (x - bar x) / sigma` where `z` = Z score or Z statistics `x` = data point `bar x` = sample mean `sigma` = sample standard deviation The mathematical equation of standard deviation is: `sigma = sqrt((x - bar x)/N)` where `N` = number of sample points What is P value? The P value is the probability that a particular value assuming the null hypothesis is true. Conventionally a P value of less than 0.05 is grounds for rejecting the null hypothesis. For the lower-tailed test or left-tailed test, the P value is expressed as: `P = Pr(TS <=ts | H_0) = cdf(ts)` And for the upper-tailed test or right-tailed test, the P value is expressed as: `P=Pr(TS>=ts |H_0) = 1-cdf(ts)` And the P value for a two-tailed test is `P = 2 xx min{Pr(TS<=ts |H_0), Pr(TS>

Power measurements and Confidence Interval

Image
Recently I assessed the power consumption of a particular server rack to determine if we had sufficient power capacity remaining to support additional server installation. Note: For my intent and purposes, the names and values have been obscured and changed to maintain confidentiality. The power capacity of the rack was 2.5 kW, while the average measure power consumption was 2.16 kW. This suggested that the remaining capacity = 2.5 - 2.16 = 0.34 kW But making decision based on a single aggregated point seems risky. So I calculated the confidence interval range instead. What is Confidence Interval The confidence interval is the value range where the mean of the population can be found based on the sample data collected. Mathematically, `CI = bar x pm z s/sqrt(n)` where `CI = "confidence interval"` `bar x = "sample mean"` `z = "confidence level value, e.g. 95%"` `s = "sample standard deviation"` `n = "sample siz

Displaying Mathematical Equations

Image
When I wrote on implementing Standard Error formula using LAMBDA, I used  CodeCogs Equation Editor webservice. Since then I have been trying a few other solutions. I put together this table for comparison. Renderer Engine Input Output Format Strong Points CodeCogs WebService LaTeX Image WYSIWYG Equation Editor Katex JavaScript MathML, TeX, and AsciiMath HTML+CSS, SVG, or MathML Fast rendering unlike MathJax and AsciiMath MathJax JavaScript MathML, TeX, and AsciiMath HTML+CSS, SVG, or MathML Widest browser compatibility AsciiMath JavaScript AsciiMath HTML+CSS, SVG, or MathML Easy to write equations, format like Excel equations. Here are some examples of a Quadratic Equation Renderer Quadratic Equation Example

Formula Name Manager Limit: ~2084 Characters

Image
While trying to implement a LAMBDA function I found myself unable to paste my formula into the Formula Name Manager. My first thought was that the LAMBDA has a character limit. But further investigation showed it was related to the Formula Name Manager, specifically the Refers to: field. Also it is not  related to the Name or the Comment field. Tweaking my formula the maximum number of characters is about 2084. Whitespaces are counted. This includes carriage returns and tabs. So, when implementing LAMBDA with the Formula Name Manager, do remember to keep your formula as concise as possible, but don't be too sloppy with variable names and indentation. That said, go edit your LAMBDA in your DC-DEN! Update: The Comment:  field limit is 256 characters.

Descriptive Statistics summary with LAMBDA

Image
One function in Excel that I find useful is the Descriptive Statistics from the Analysis Toolpak Add-In. At a glance I see a summary of the sample data. However I also find it cumbersome to use. It requires you to add-in Analysis Toolpak - not loaded by default. I wonder why Microsoft choses not to pre-load in Excel even though it has been available since Excel 2000 (maybe even earlier?). It launches a dialog. Recently, this becomes an issue as it unavailable in Excel Web. It returns a static result, not an auto recalculating function, i.e. the result is not updated if and when the data is updated. Of the 3 reasons above, I find the last most annoying. While field/laboratory sample data does not change after collection, but input data from external sources can be changing frequently. Any report based on external sources would have to be painstakingly updated manually. So in this blog, I will create a Descriptive Statistics function with LAMBDA that would recalculate automatically just